Beyond Variance: Alternative Risk Measures for Portfolio Management
Limitations of Standard Deviation as a Risk Measure
Modern Portfolio Theory (MPT) has traditionally used standard deviation (or variance) as the primary measure of risk. While this approach has proven valuable, it has several limitations:
- It treats upside and downside deviations equally, despite investors typically caring more about downside risk
- It assumes returns are normally distributed, which is rarely the case in financial markets
- It fails to capture tail risk (the risk of extreme events)
- It doesn't account for the timing or sequence of returns, which matters for investors with specific time horizons
To address these limitations, financial analysts and portfolio managers have developed alternative risk measures. Let's explore some of the most important ones.
Downside Risk Measures
1. Semivariance and Semideviation
Semivariance measures the dispersion of returns below a specified target (often the mean return or zero). Unlike standard deviation, it only penalizes "bad" volatility. Semideviation is simply the square root of semivariance.
This approach aligns better with investor psychology since most investors are more concerned about returns falling below expectations than exceeding them.
2. Maximum Drawdown
Maximum drawdown measures the largest peak-to-trough decline in portfolio value over a specific time period. It addresses the question: "What's the worst percentage decline I might experience?"
For example, a maximum drawdown of 30% means that at some point, the portfolio declined 30% from its previous peak before recovering.
3. Value at Risk (VaR)
Value at Risk estimates the maximum loss within a confidence level over a specific time horizon. For instance, a one-day 95% VaR of $10,000 means there's a 95% probability that the portfolio won't lose more than $10,000 in one day.
VaR is widely used in risk management but has limitations, particularly in capturing tail risk.
4. Conditional Value at Risk (CVaR)/Expected Shortfall
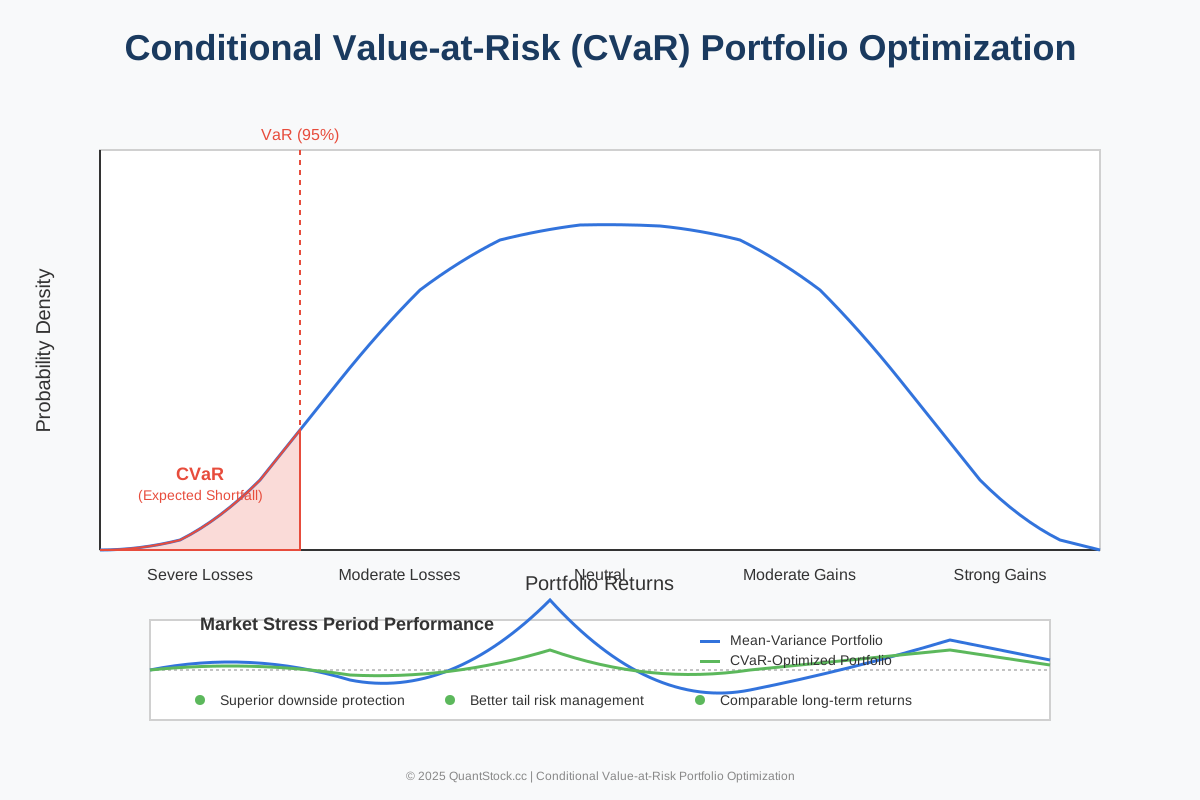
CVaR addresses a key limitation of VaR by measuring the expected loss given that the loss exceeds the VaR threshold. It provides a better understanding of the severity of potential losses in the tail of the distribution.
Relative Risk Measures
1. Beta
Beta measures the volatility or systematic risk of a security or portfolio in comparison to the market as a whole. A beta of 1 indicates that the security's price moves with the market, while a beta less than 1 means it's less volatile than the market.
2. Tracking Error
Tracking error measures how closely a portfolio follows its benchmark index. It's calculated as the standard deviation of the difference between the portfolio's returns and the benchmark's returns.
This is particularly important for index funds and ETFs that aim to replicate benchmark performance.
Distributional Risk Measures
1. Skewness
Skewness measures the asymmetry of the return distribution. Negative skewness indicates a longer left tail (more extreme negative returns), while positive skewness indicates a longer right tail (more extreme positive returns).
All else equal, investors generally prefer positive skewness.
2. Kurtosis
Kurtosis measures the "fatness" of the tails of a distribution. High kurtosis (leptokurtic) distributions have fatter tails, meaning there's a higher probability of extreme outcomes than would be expected in a normal distribution.
Most financial returns exhibit high kurtosis, which is one reason why standard deviation can underestimate actual risk.
Applications in Portfolio Management
Post-Modern Portfolio Theory (PMPT)
PMPT extends MPT by using downside risk measures instead of standard deviation. This approach better aligns with investor preferences and produces portfolios that specifically minimize the risk of negative outcomes.
Risk Parity
Risk parity is an approach to portfolio management that focuses on allocating risk rather than capital. Each asset class is weighted to contribute equally to the portfolio's overall risk, often measured using various risk metrics beyond standard deviation.
Integrated Risk Management
Sophisticated portfolio managers often use multiple risk measures in combination to gain a more comprehensive understanding of portfolio risk. For example:
- Standard deviation for overall volatility
- Maximum drawdown for worst-case scenario analysis
- CVaR for tail risk
- Beta for market risk
Conclusion
While standard deviation remains a useful and widely used risk measure, incorporating alternative risk metrics can provide a more complete picture of a portfolio's risk profile. This is particularly important in today's complex and interconnected markets, where extreme events seem to occur more frequently than normal distributions would predict.
Our portfolio optimization tools incorporate multiple risk measures to help you build portfolios that not only maximize returns relative to volatility but also account for downside risk, tail risk, and other important risk dimensions.
Free Trading Math & Risk Cheat Sheet
Every key formula in one PDF: breakeven win rates, expectancy, position sizing, drawdown recovery, volatility drag, VaR and CVaR. Plus occasional emails when we publish new quant tools.