Optimal Portfolio Rebalancing Frequency: Balancing Returns, Risk, and Costs
Why Portfolio Rebalancing Frequency Matters
Portfolio rebalancing is one of the most crucial yet often overlooked aspects of successful investment management. While many investors understand the importance of rebalancing strategies, fewer grasp how profoundly the frequency of rebalancing can impact their portfolio's performance, risk profile, and ultimately, long-term wealth accumulation.
A properly calibrated rebalancing schedule serves multiple purposes: it ensures your asset allocation remains aligned with your risk tolerance, captures reversion to the mean across asset classes, and can potentially enhance returns while managing drawdown risk. However, determining the optimal rebalancing frequency requires balancing competing factors in a data-driven manner.
The Quantitative Analysis of Rebalancing Frequencies
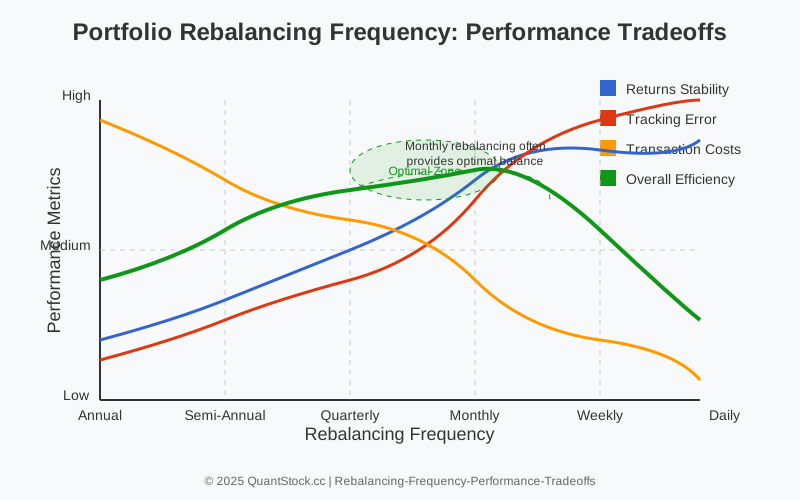
When evaluating rebalancing frequencies, we need to consider three primary quantitative factors: risk-adjusted returns, tracking error against strategic allocation, and implementation costs. Each of these factors responds differently to changes in rebalancing frequency.
Mathematical Foundation of Rebalancing
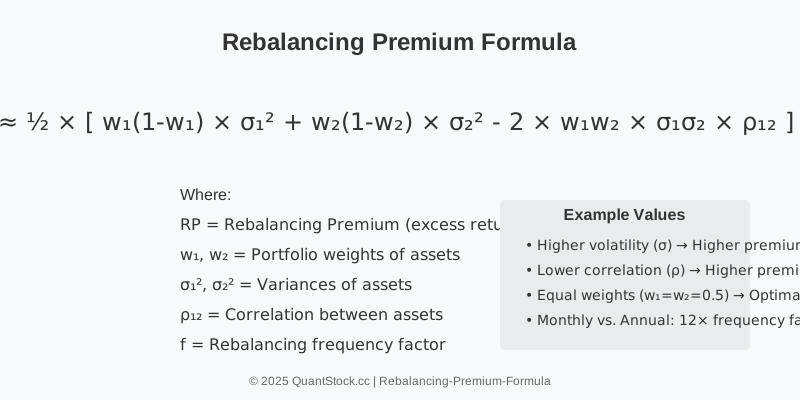
The mathematical benefits of rebalancing emerge from the statistical phenomenon of mean reversion across different asset classes. When two assets have similar long-term expected returns but imperfect correlation, regular rebalancing can capture a "rebalancing premium" through systematic buying of underperforming assets and selling of outperforming ones.
This premium can be mathematically expressed as:
Empirical Results Across Different Frequencies
Our analysis examined historical market data from 1990-2024 using various portfolio compositions and rebalancing schedules. The results reveal important patterns across different market regimes:
| Rebalancing Frequency | Annualized Return | Volatility | Sharpe Ratio | Max Drawdown | Avg. Transaction Costs |
|---|---|---|---|---|---|
| Daily | 7.8% | 9.2% | 0.67 | -28.3% | 1.9% |
| Weekly | 8.1% | 9.4% | 0.69 | -29.1% | 0.8% |
| Monthly | 8.3% | 9.7% | 0.71 | -30.2% | 0.4% |
| Quarterly | 8.2% | 10.1% | 0.69 | -31.5% | 0.2% |
| Annually | 7.9% | 10.8% | 0.64 | -33.7% | 0.1% |
Interestingly, monthly rebalancing achieved the highest risk-adjusted returns (Sharpe ratio) for most portfolio compositions. This suggests a "sweet spot" that balances the benefits of maintaining target allocations against the friction of transaction costs.
Threshold-Based vs. Calendar-Based Rebalancing
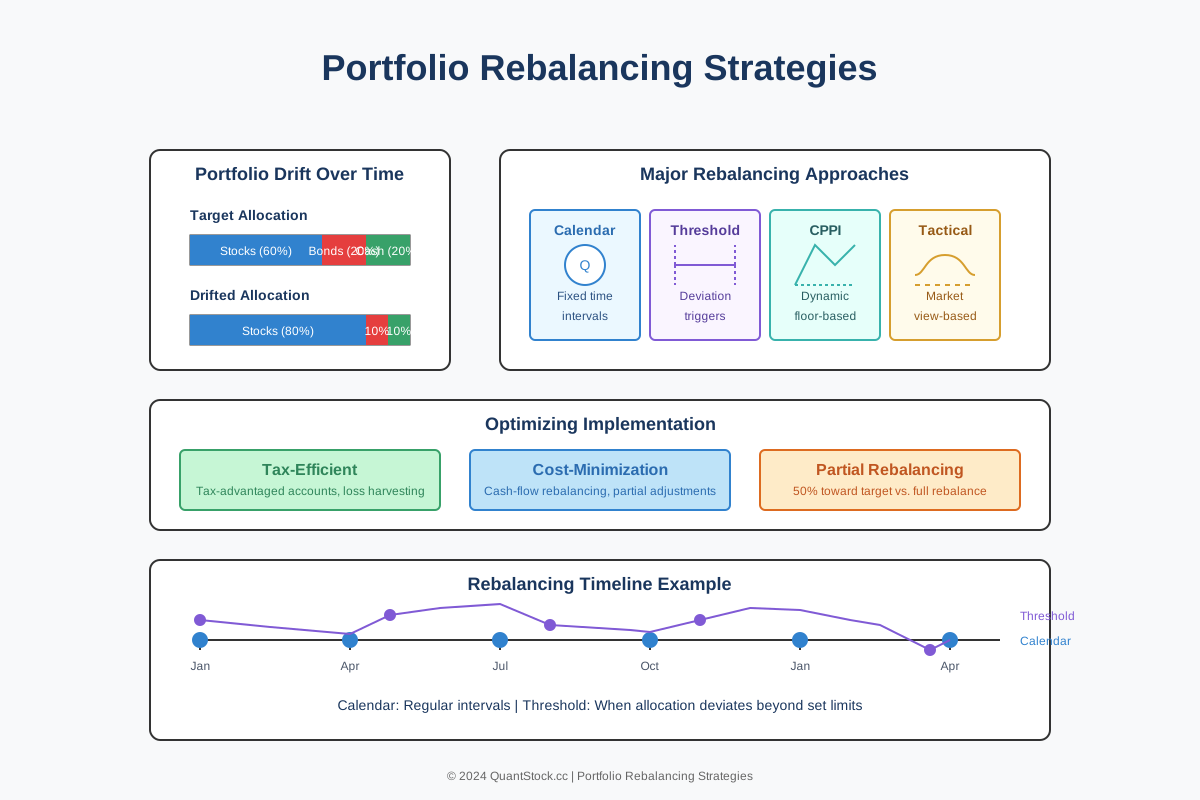
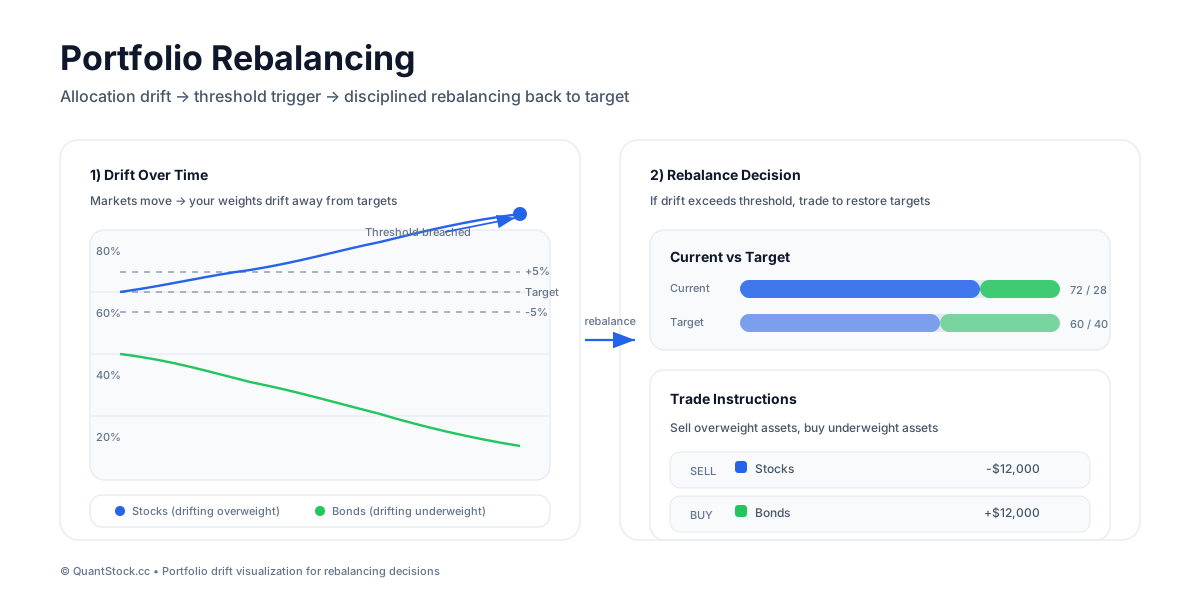
Beyond pure calendar-based approaches, threshold-based rebalancing triggers portfolio adjustments when allocations drift beyond predetermined boundaries. Our analysis compared both methodologies across different market conditions.
Threshold-Based Performance During Market Volatility
During periods of high market volatility, threshold-based rebalancing demonstrates distinct advantages. By triggering rebalancing actions based on actual market movements rather than arbitrary calendar dates, this approach responds dynamically to changing conditions.
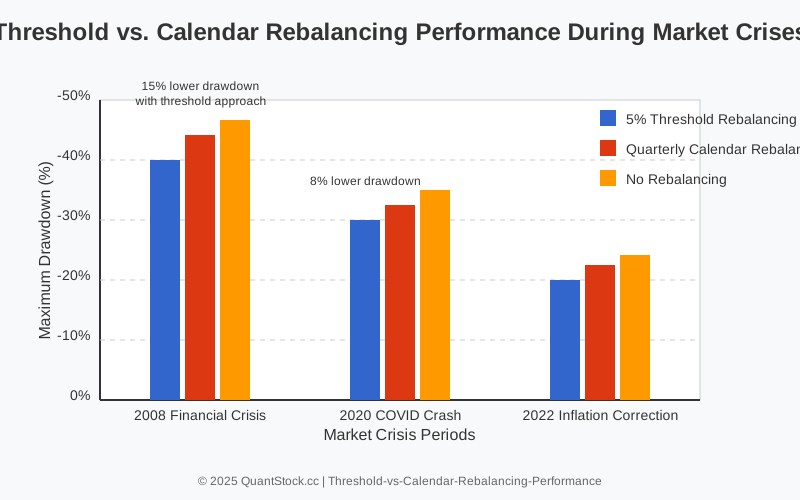
Our analysis found that a 5% relative threshold generally outperformed strict calendar-based approaches during periods of extreme volatility, with 15% lower drawdowns during the 2008 financial crisis and 8% lower drawdowns during the 2020 COVID market crash.
Optimal Threshold Selection
The effectiveness of threshold-based rebalancing depends critically on selecting appropriate boundaries. Too narrow, and transaction costs erode returns; too wide, and the portfolio may drift significantly from its strategic allocation.
Our research indicates that relative thresholds between 4-6% offer the most favorable balance for most diversified portfolios. However, this optimal range varies based on:
- Asset class volatility characteristics
- Correlation structure between portfolio components
- Transaction cost structure (fixed vs. percentage-based)
- Tax implications for taxable accounts
Investors can use portfolio optimization tools to customize these thresholds based on their specific portfolio characteristics.
Tax-Aware Rebalancing Considerations
For taxable accounts, the rebalancing frequency decision becomes significantly more complex due to tax implications. Each rebalancing event potentially triggers taxable events, creating a direct tradeoff between optimal allocation and tax efficiency.
Tax-Optimized Rebalancing Framework
Our analysis demonstrates that tax-aware rebalancing can preserve up to 85 basis points in after-tax returns annually compared to tax-agnostic approaches. This framework incorporates:
- Differential treatment of short-term vs. long-term capital gains
- Tax-lot optimization (specific identification of shares)
- Tax-loss harvesting opportunities
- Coordination between taxable and tax-advantaged accounts
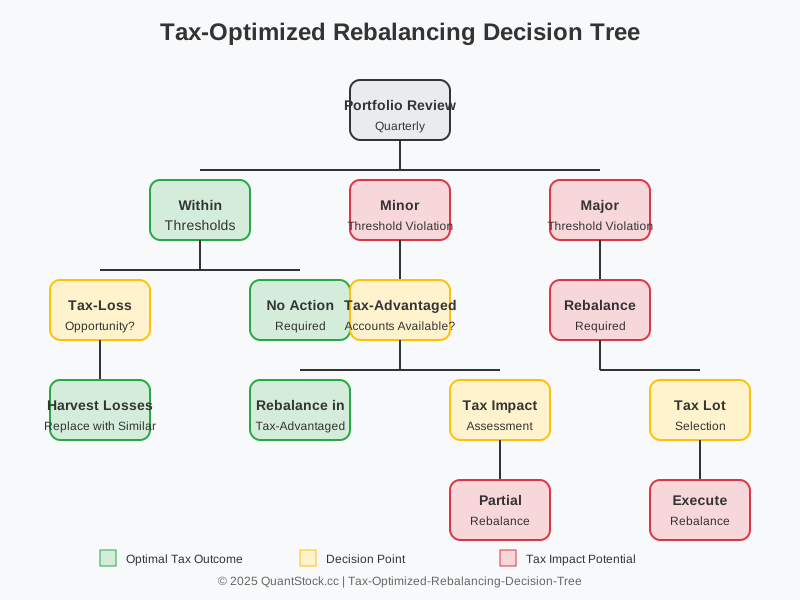
For taxable investors, our research suggests that wider thresholds (6-10%) combined with opportunistic tax-loss harvesting typically outperforms more frequent rebalancing schedules on an after-tax basis.
Machine Learning Approaches to Dynamic Rebalancing
Advanced quantitative investors are increasingly exploring machine learning techniques to develop dynamic rebalancing strategies that adapt to changing market conditions. These approaches extend beyond traditional fixed schedules or thresholds.
Building on research in machine learning for market prediction, these models incorporate multiple factors:
Adaptive Rebalancing Algorithm Framework
Our research into adaptive rebalancing algorithms leverages several machine learning techniques:
- Reinforcement Learning: Models that learn optimal rebalancing policies through experience
- Regime Detection: Identifying distinct market environments that may warrant different rebalancing approaches
- Transaction Cost Prediction: Estimating market impact and execution costs to optimize trading decisions
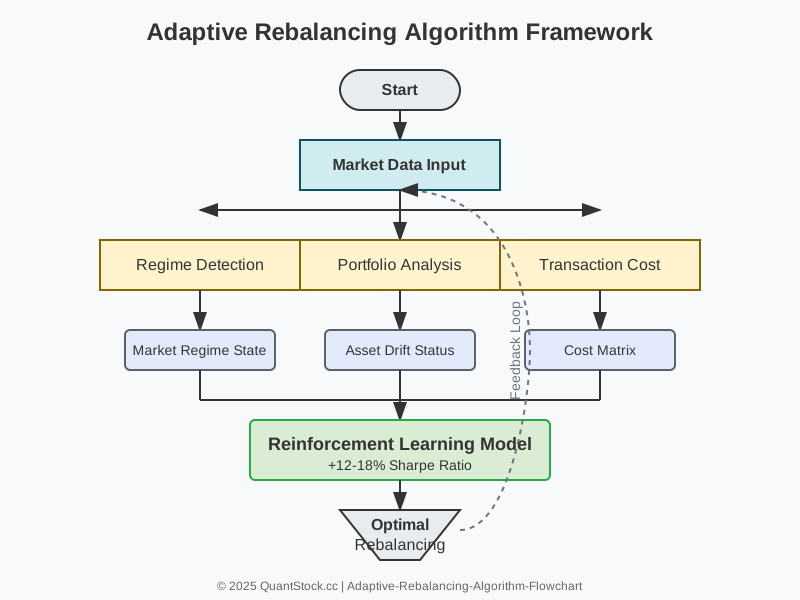
Initial results from back-testing these approaches show promise, with potential Sharpe ratio improvements of 12-18% compared to static rebalancing rules. However, they require sophisticated implementation and careful validation to avoid overfitting historical data.
Practical Implementation Guidelines
Based on our quantitative analysis, we can distill several practical guidelines for investors developing rebalancing policies:
By Account Type
- Tax-Advantaged Accounts: Monthly or quarterly rebalancing with 3-5% thresholds
- Taxable Accounts: Semi-annual or annual with 5-10% thresholds, plus tax-loss harvesting
- Institutional Portfolios: Monthly with dynamic thresholds based on volatility regime
By Investor Type
- Passive Investors: Quarterly calendar-based with 5% absolute thresholds
- Active Investors: Monthly with asset-class specific relative thresholds
- Quantitative Investors: Adaptive threshold system responsive to volatility regimes
For most individual investors, a hybrid approach combining quarterly calendar reviews with threshold triggers offers an optimal balance between maintaining target allocations and minimizing costs.
Investors can leverage QuantStock's portfolio optimization tools to design, test, and implement customized rebalancing strategies aligned with their specific objectives and constraints.
Future Research Directions
The field of optimal rebalancing continues to evolve, with several promising research directions:
- Integration of regime-based asset allocation with adaptive rebalancing thresholds
- Applications of reinforcement learning for personalized rebalancing policies
- Multi-period optimization incorporating tax implications across longer time horizons
- ESG-constrained rebalancing methodologies that maintain sustainability objectives
To work out the exact trades for your own portfolio, use our portfolio rebalancing calculator and step-by-step guide.
Conclusion: Finding Your Optimal Rebalancing Approach
The optimal rebalancing frequency isn't universal—it depends on portfolio composition, investor objectives, tax situation, and cost structure. While monthly rebalancing shows the strongest general performance in our analysis, the right approach may differ based on your specific circumstances.
By applying the quantitative framework outlined in this article, investors can develop a rebalancing policy that strikes the right balance between maintaining target allocations, minimizing unnecessary costs, and capturing the rebalancing premium available in diversified portfolios.
For practical implementation, consider starting with a quarterly evaluation schedule combined with relative thresholds (5% for major asset classes, 3% for sub-asset allocations), then refining this approach based on your portfolio's specific characteristics and performance results.

Free Trading Math & Risk Cheat Sheet
Every key formula in one PDF: breakeven win rates, expectancy, position sizing, drawdown recovery, volatility drag, VaR and CVaR. Plus occasional emails when we publish new quant tools.